Statistics
Statistics use large simulations to quantify long-term blackjack results, helping compare EV, ROI, variance, and risk across rules, strategies, seats, and session settings.
These statistics are for understanding the relationship between strategy, rules, bet ramps, and variance. They do not guarantee that real play will produce the same results. Blackjack edges are usually small, while short-term swings are large; even if a simulation shows better EV or ROI for certain settings, real outcomes are still affected by variance, table rules, penetration, table limits, bankroll, and execution consistency. These numbers are for learning and comparison, not a promise of stable profit.
Round Stats
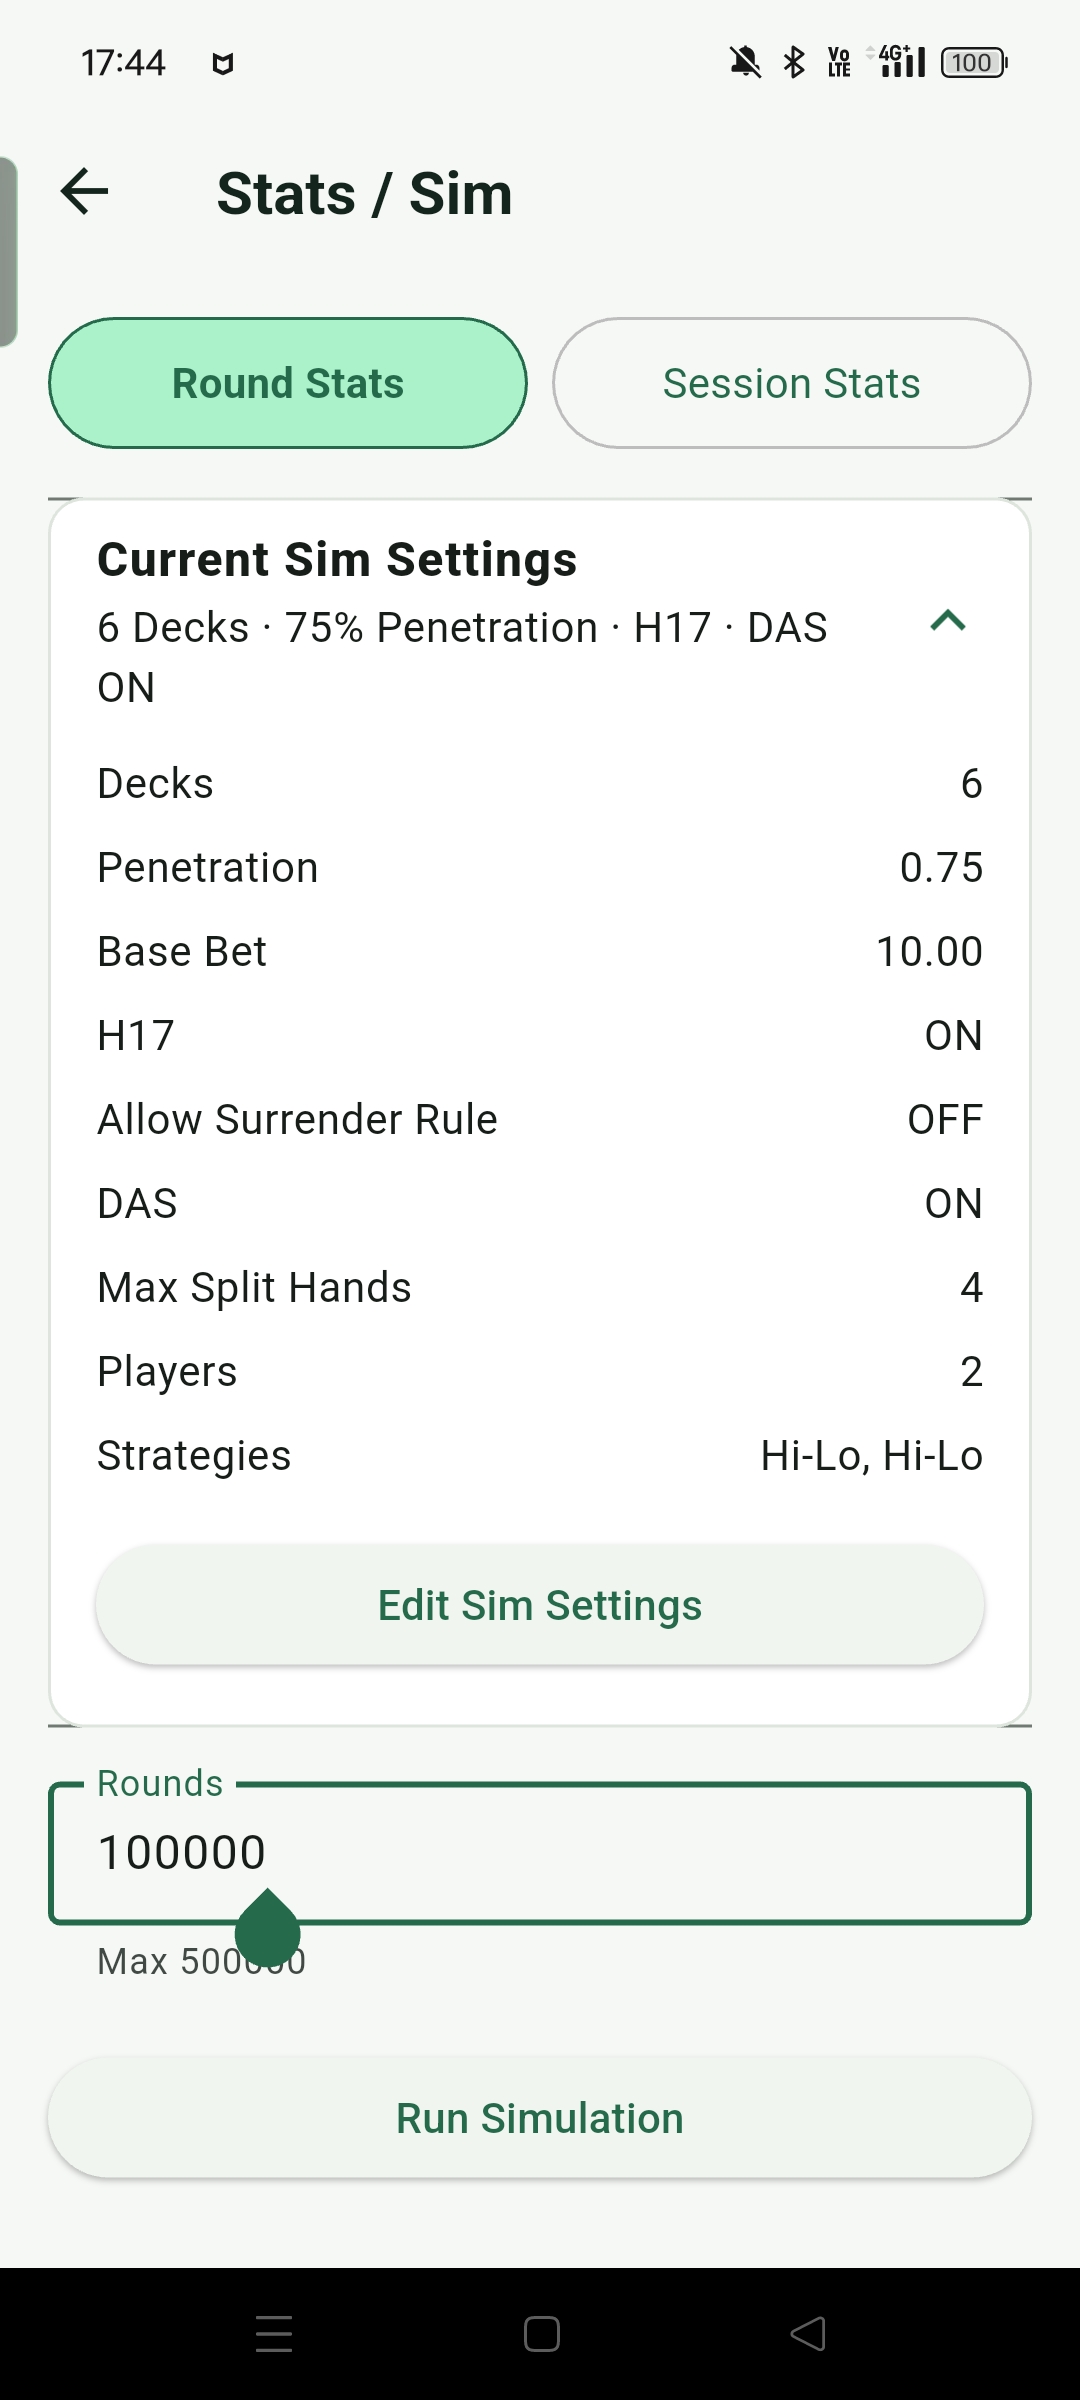
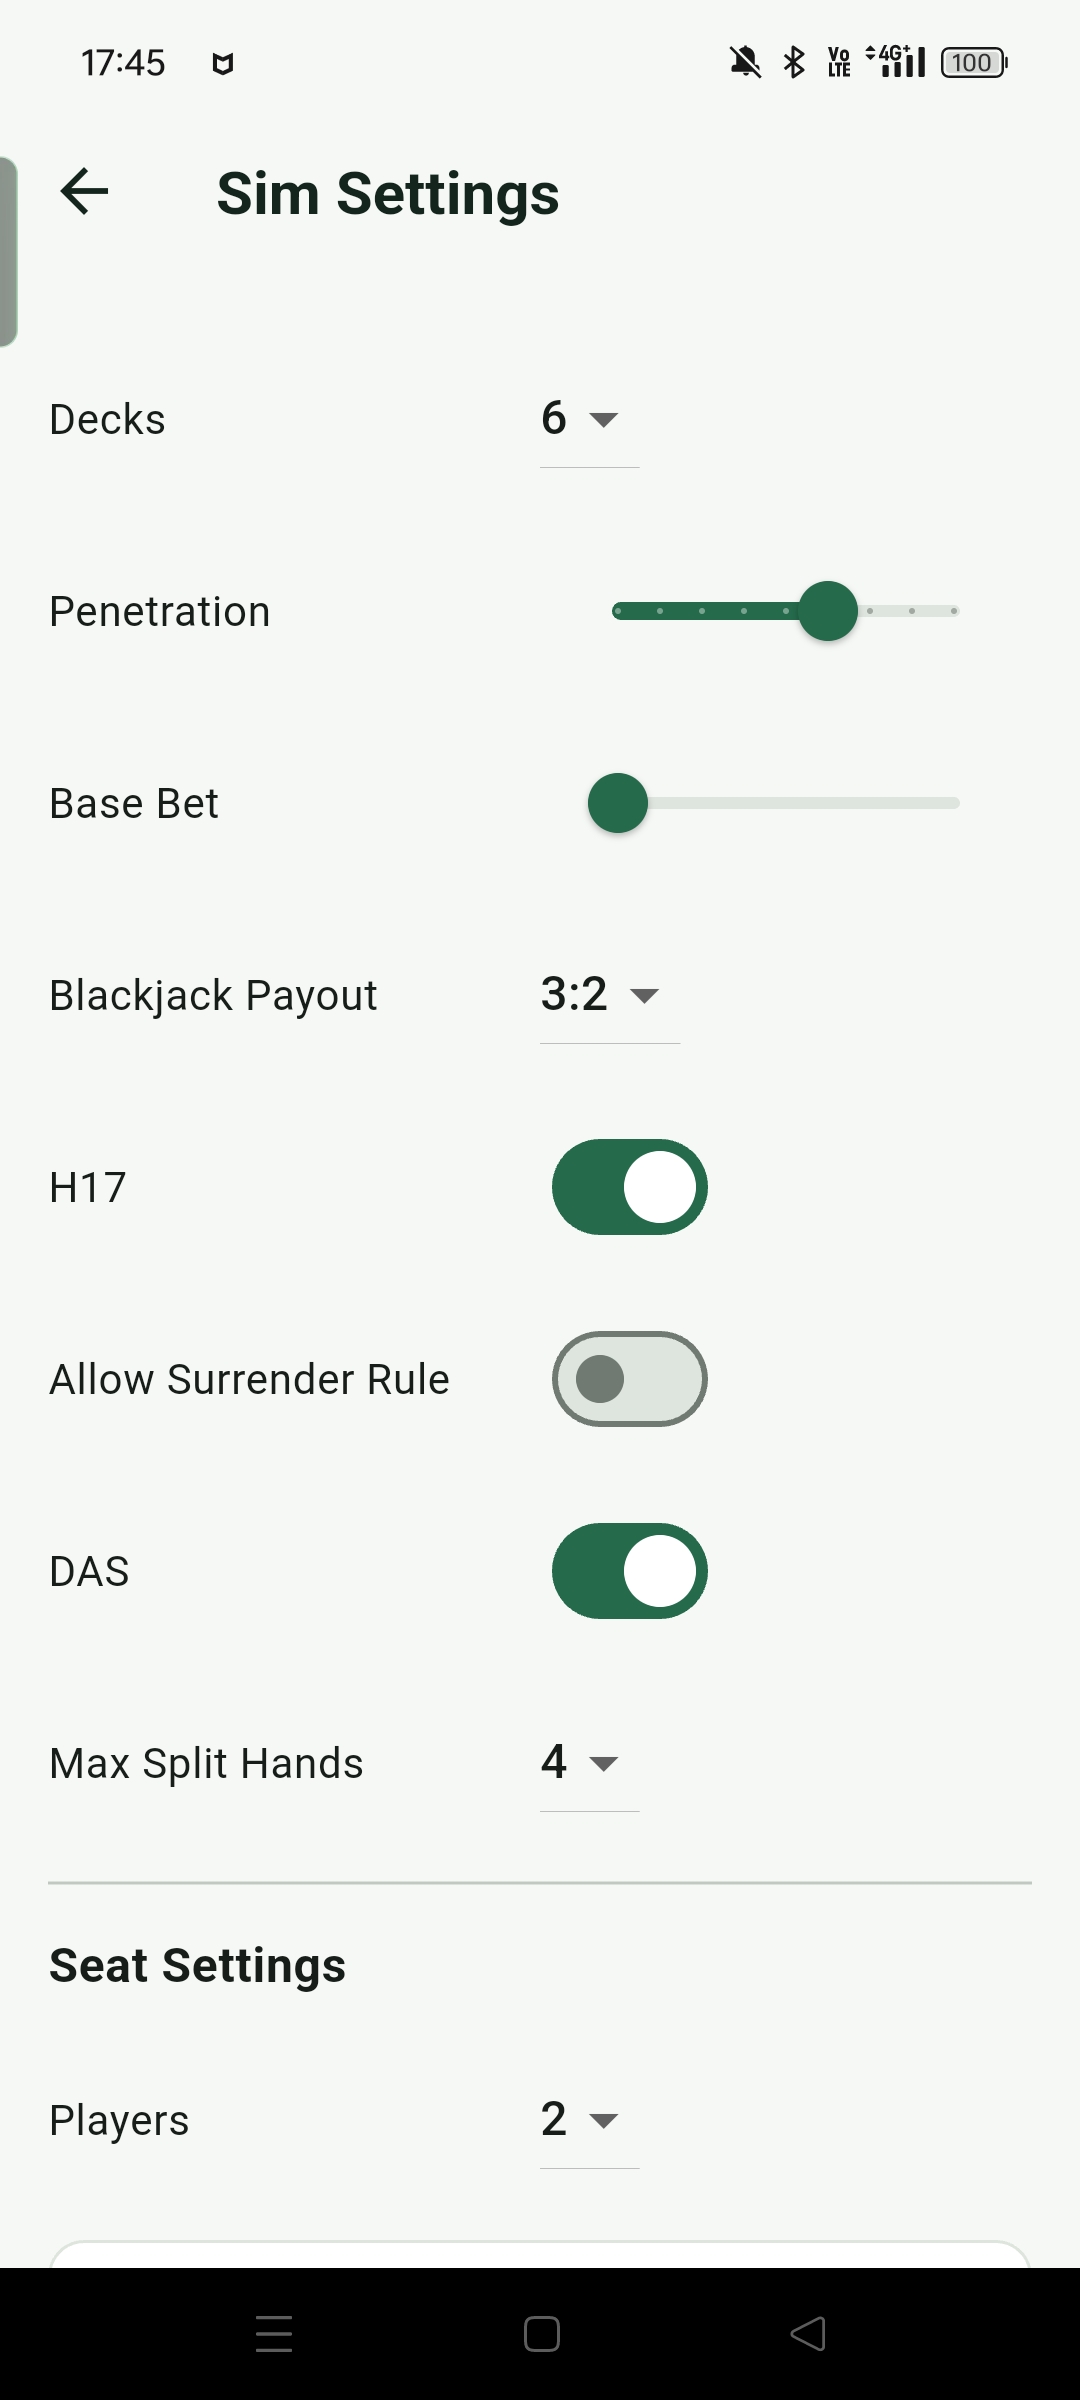
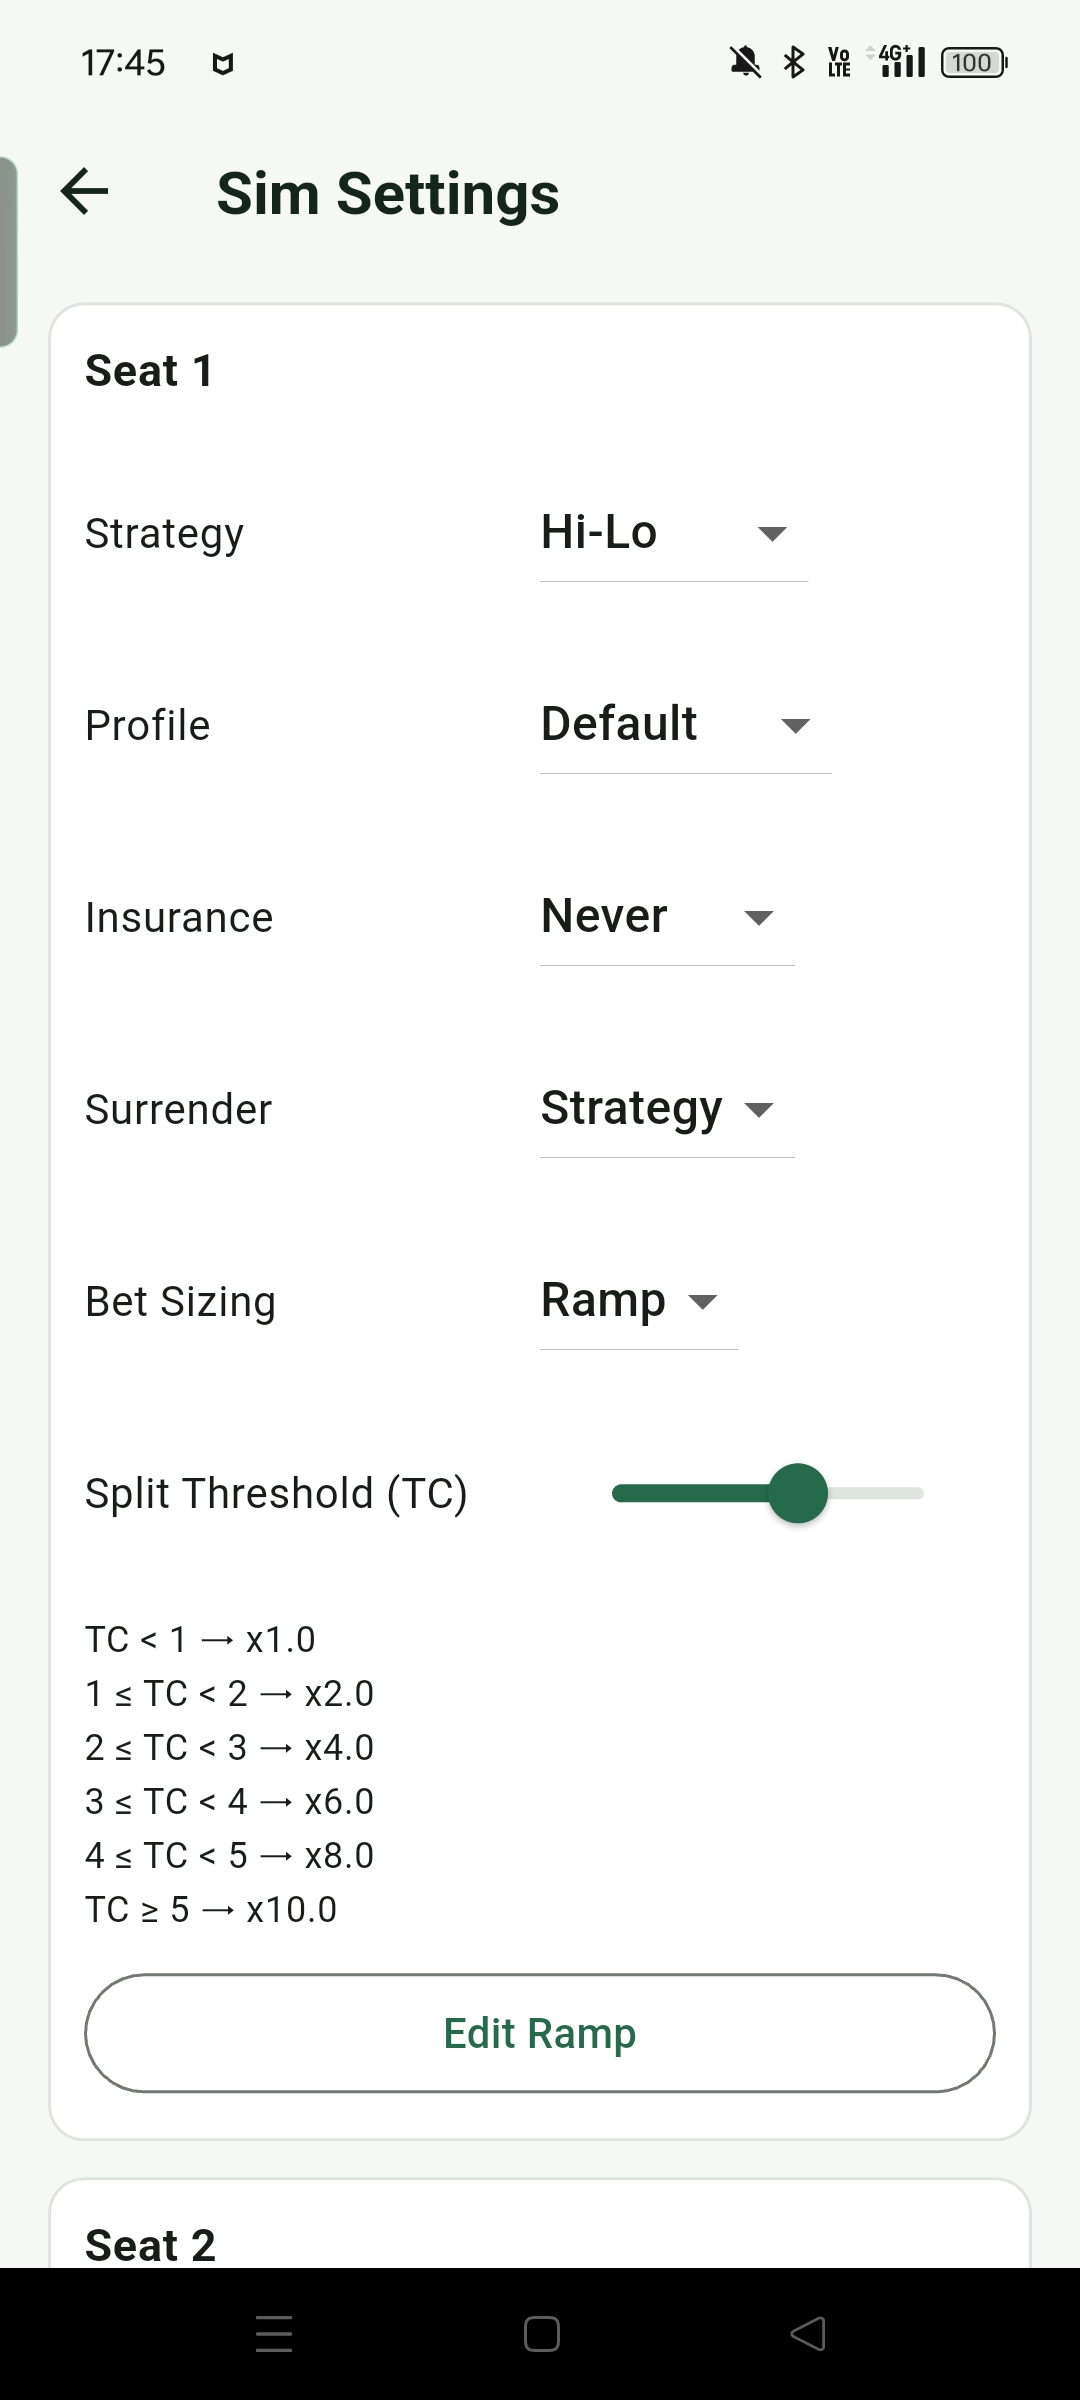
The core idea of Round Stats is to set the table rules and strategy first, then let the computer simulate many rounds under those conditions. Strategies can be Basic, Hi-Lo, KO, Red 7, FELT, Zen, Hi-Opt I, or Omega II, with different Bet Ramps, and you can decide whether surrender, insurance, and related decisions follow strategy or deviations. The simulation can run up to 500,000 rounds, then compare long-term performance across settings.
Blackjack results can still swing noticeably, especially when a counting strategy uses a bet ramp. Even after many simulated rounds, the result will not perfectly match theoretical probability. From another angle, that is closer to real play: real results do not land exactly on EV every stretch, and swings are part of the game. Running the same settings multiple times helps reveal the gap between short-term outcomes and long-term expectation.
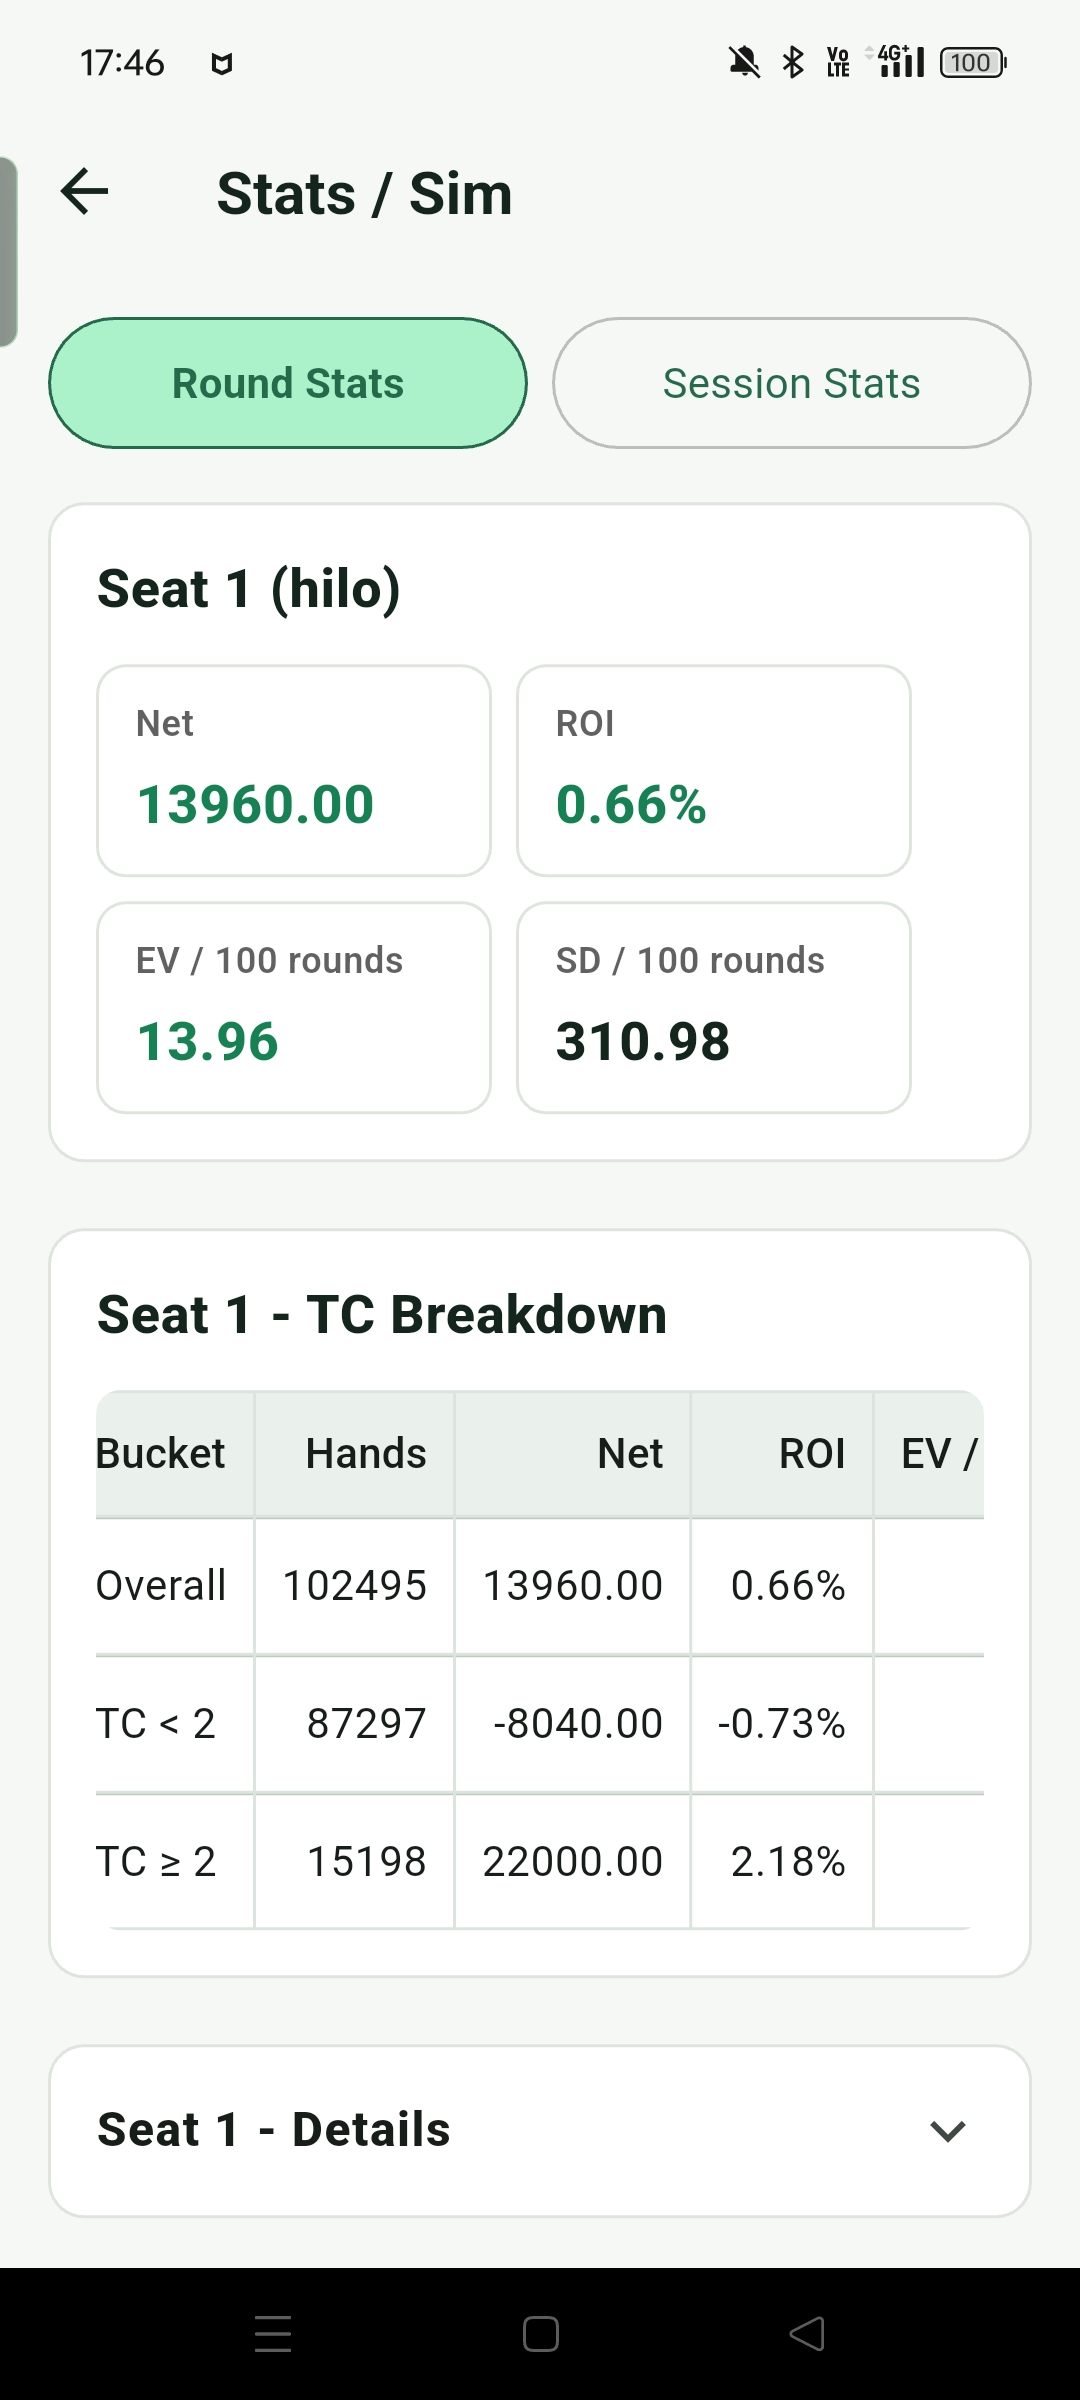
Each seat can set its own TC threshold k independently, so different counting systems or Bet Ramps can each use the most suitable threshold. Counting becomes positive EV mainly because higher True Count zones are favorable. After setting k, results are split into TC below k and TC greater than or equal to k, making it easier to compare high-TC zones against the rest.
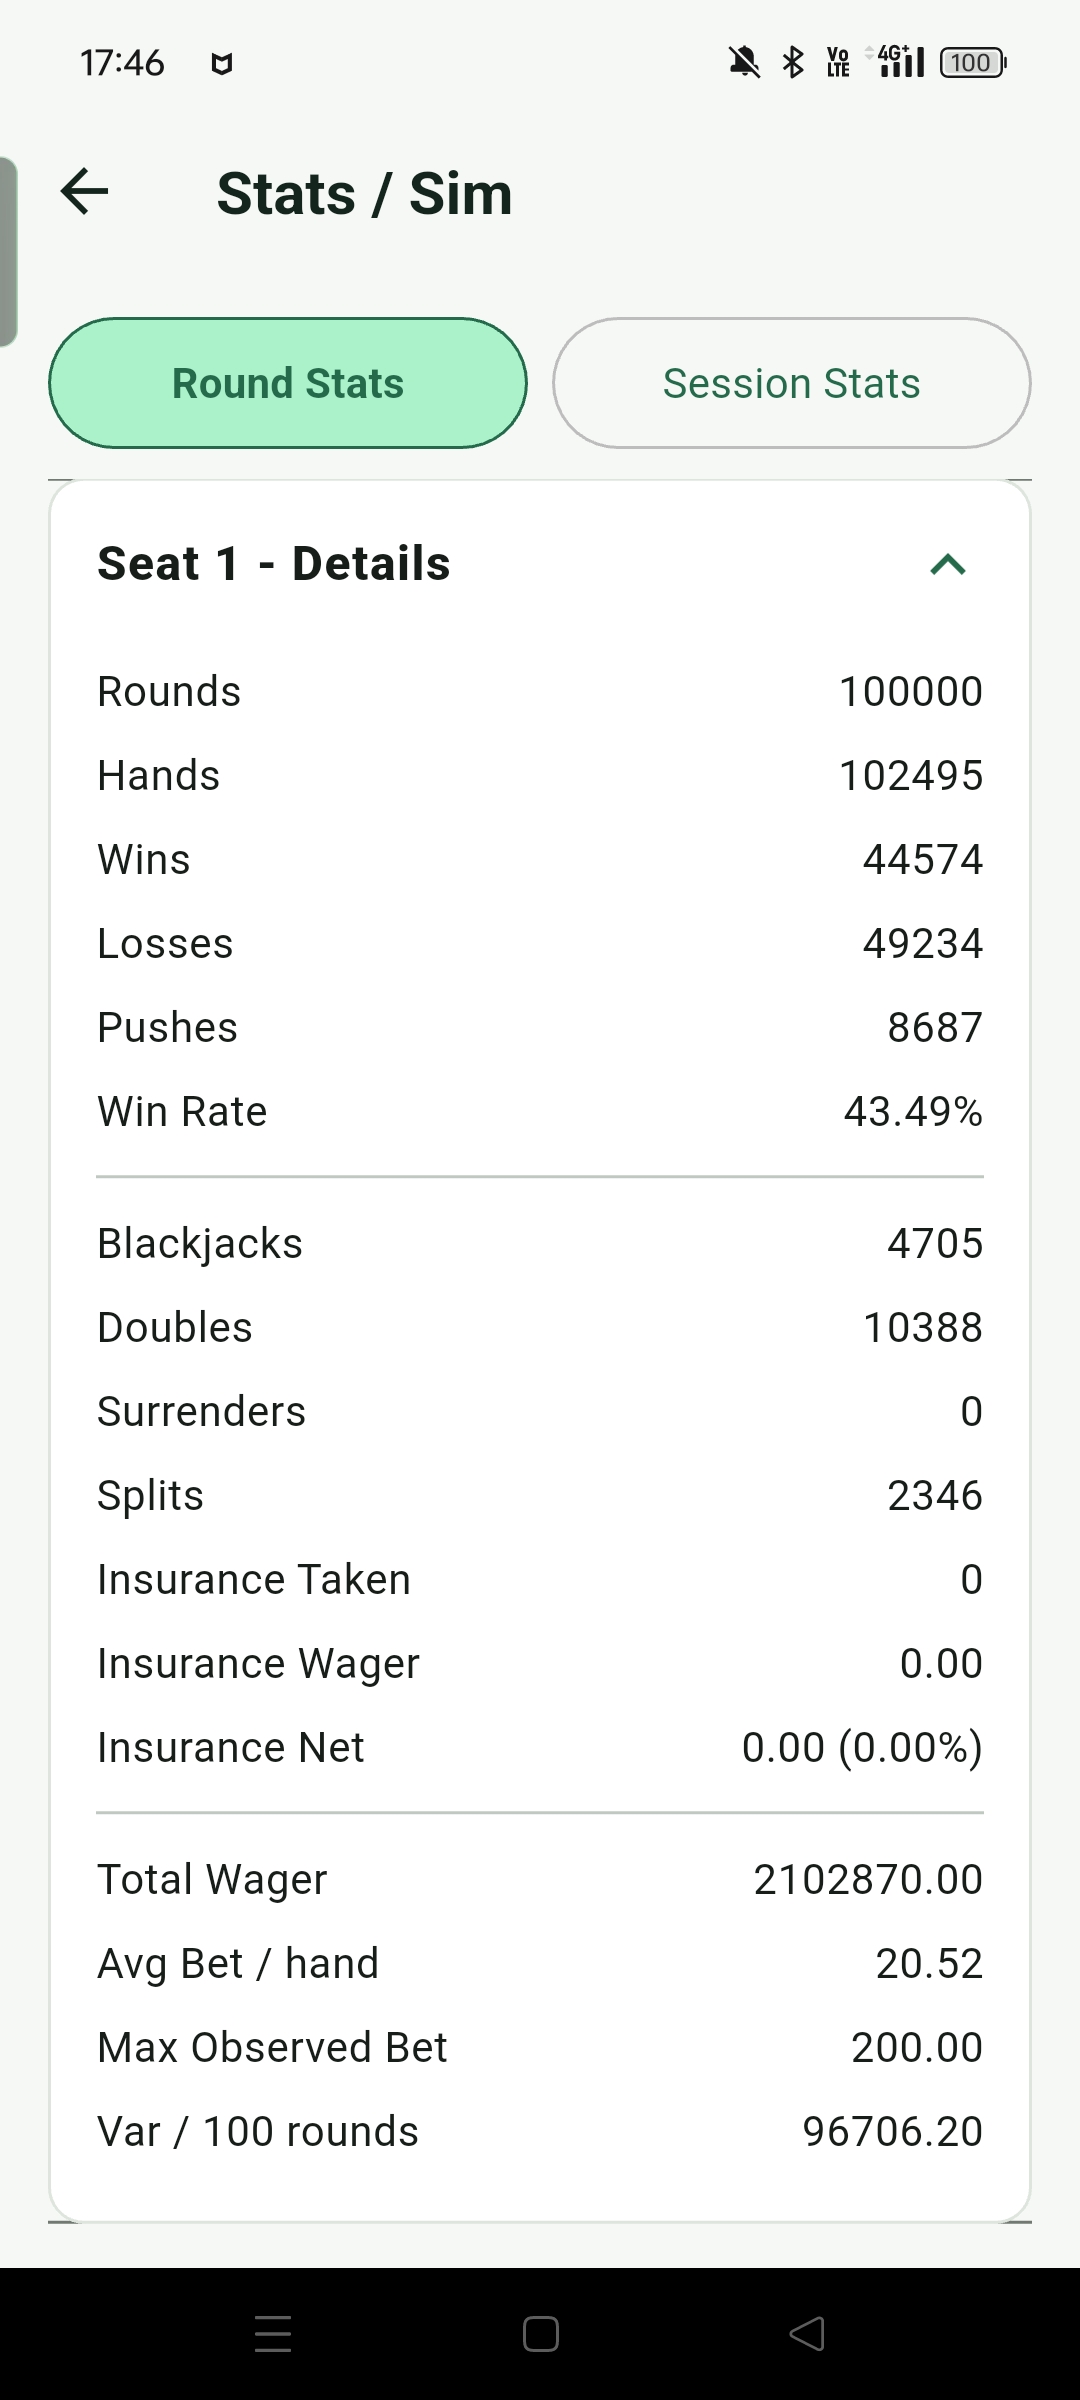
Round Stats can also set the number of players at the table and the strategy used by each player. This allows comparison under the same rules, table, and shoe sequence, such as different Bet Ramps, surrender versus no surrender, or Basic versus Hi-Lo. Results include net profit, ROI, EV / 100 rounds, and SD / 100 rounds, plus details such as surrender, insurance, split counts, and win/loss rates to show what each strategy actually encounters.
Session Stats
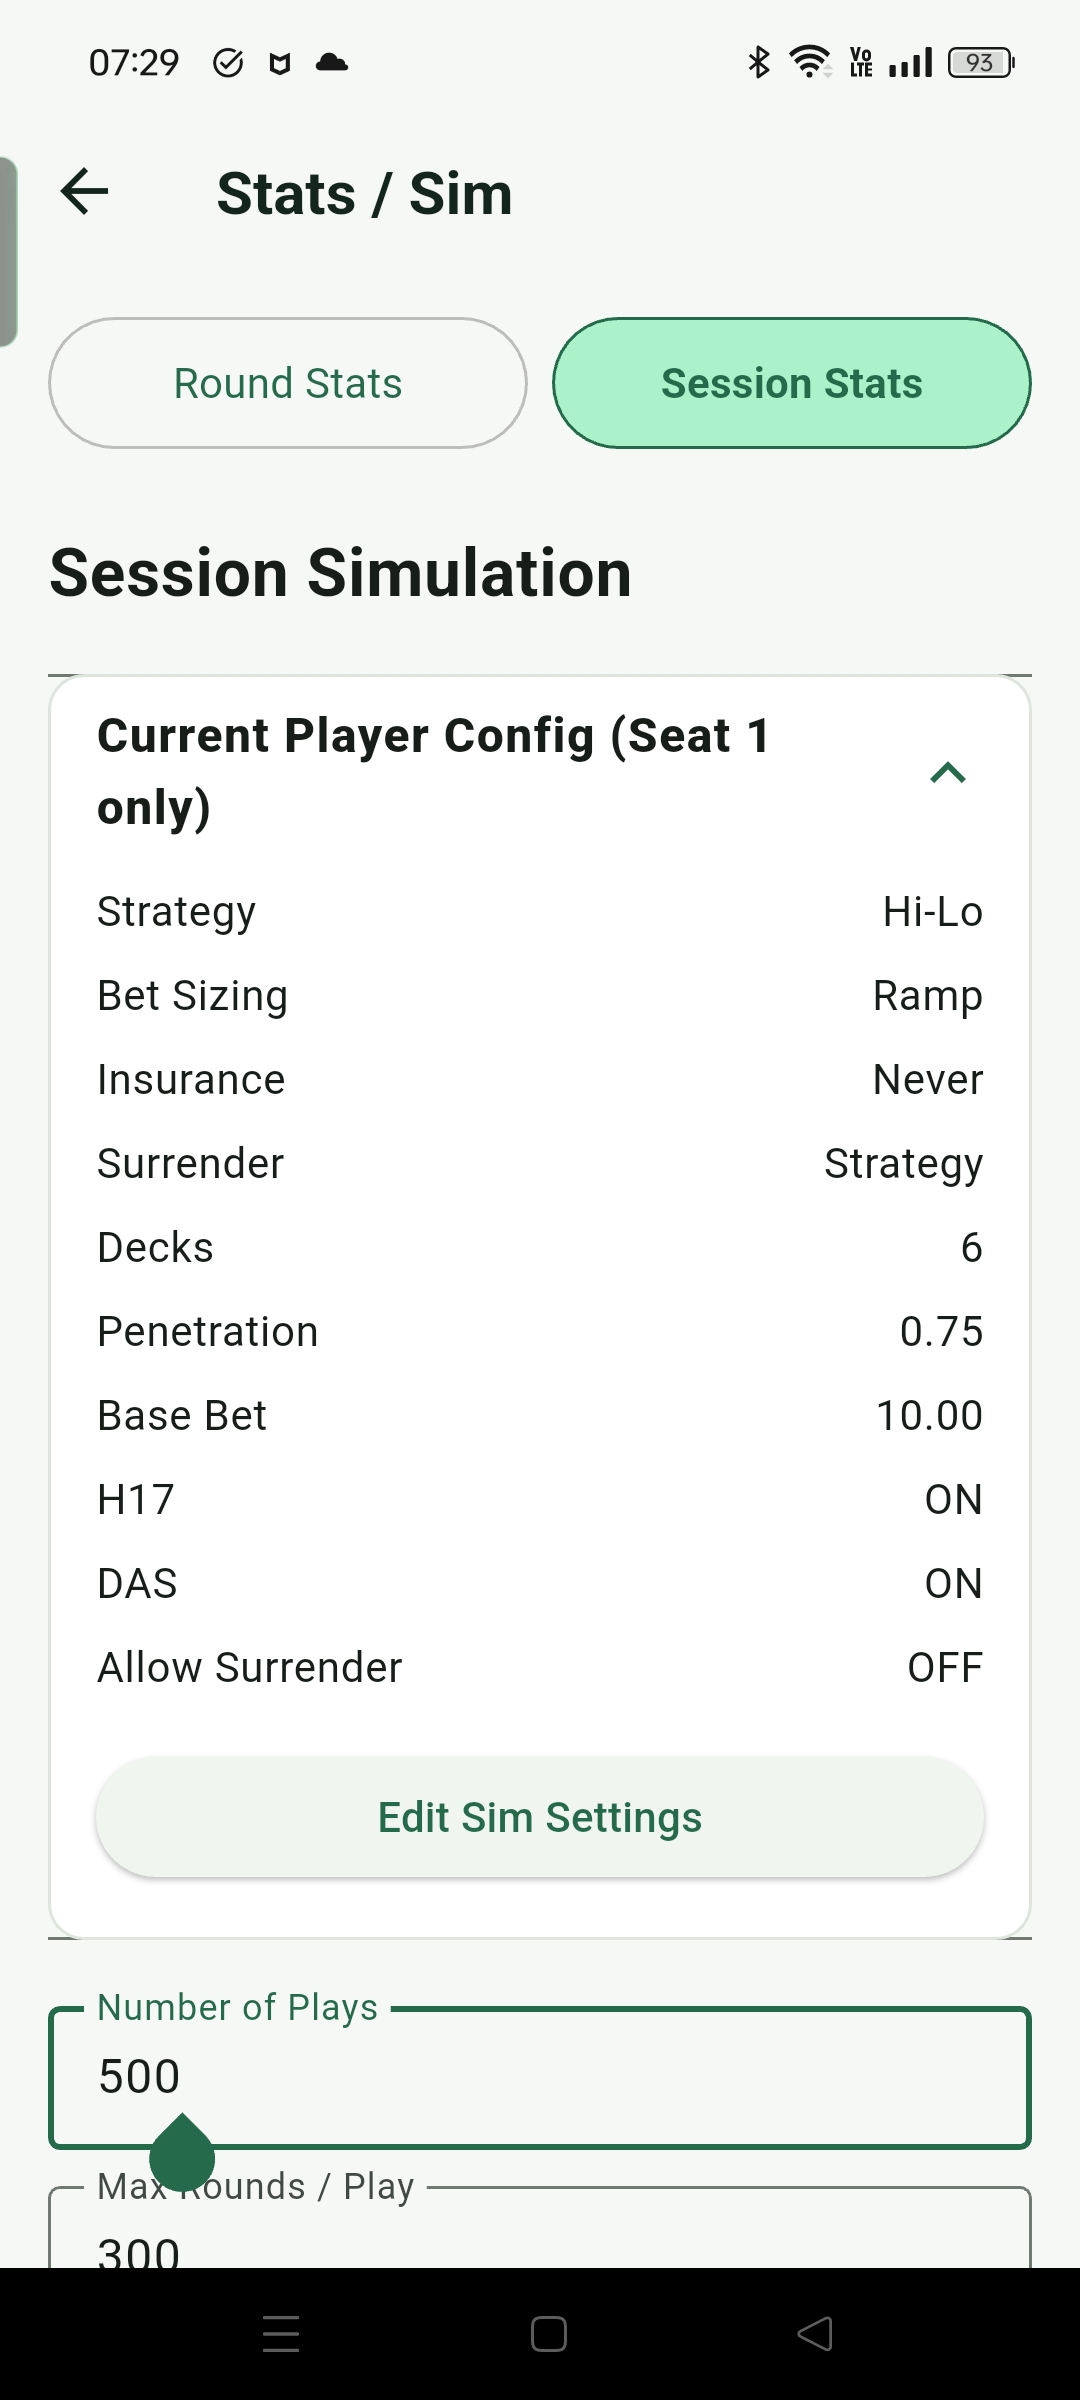
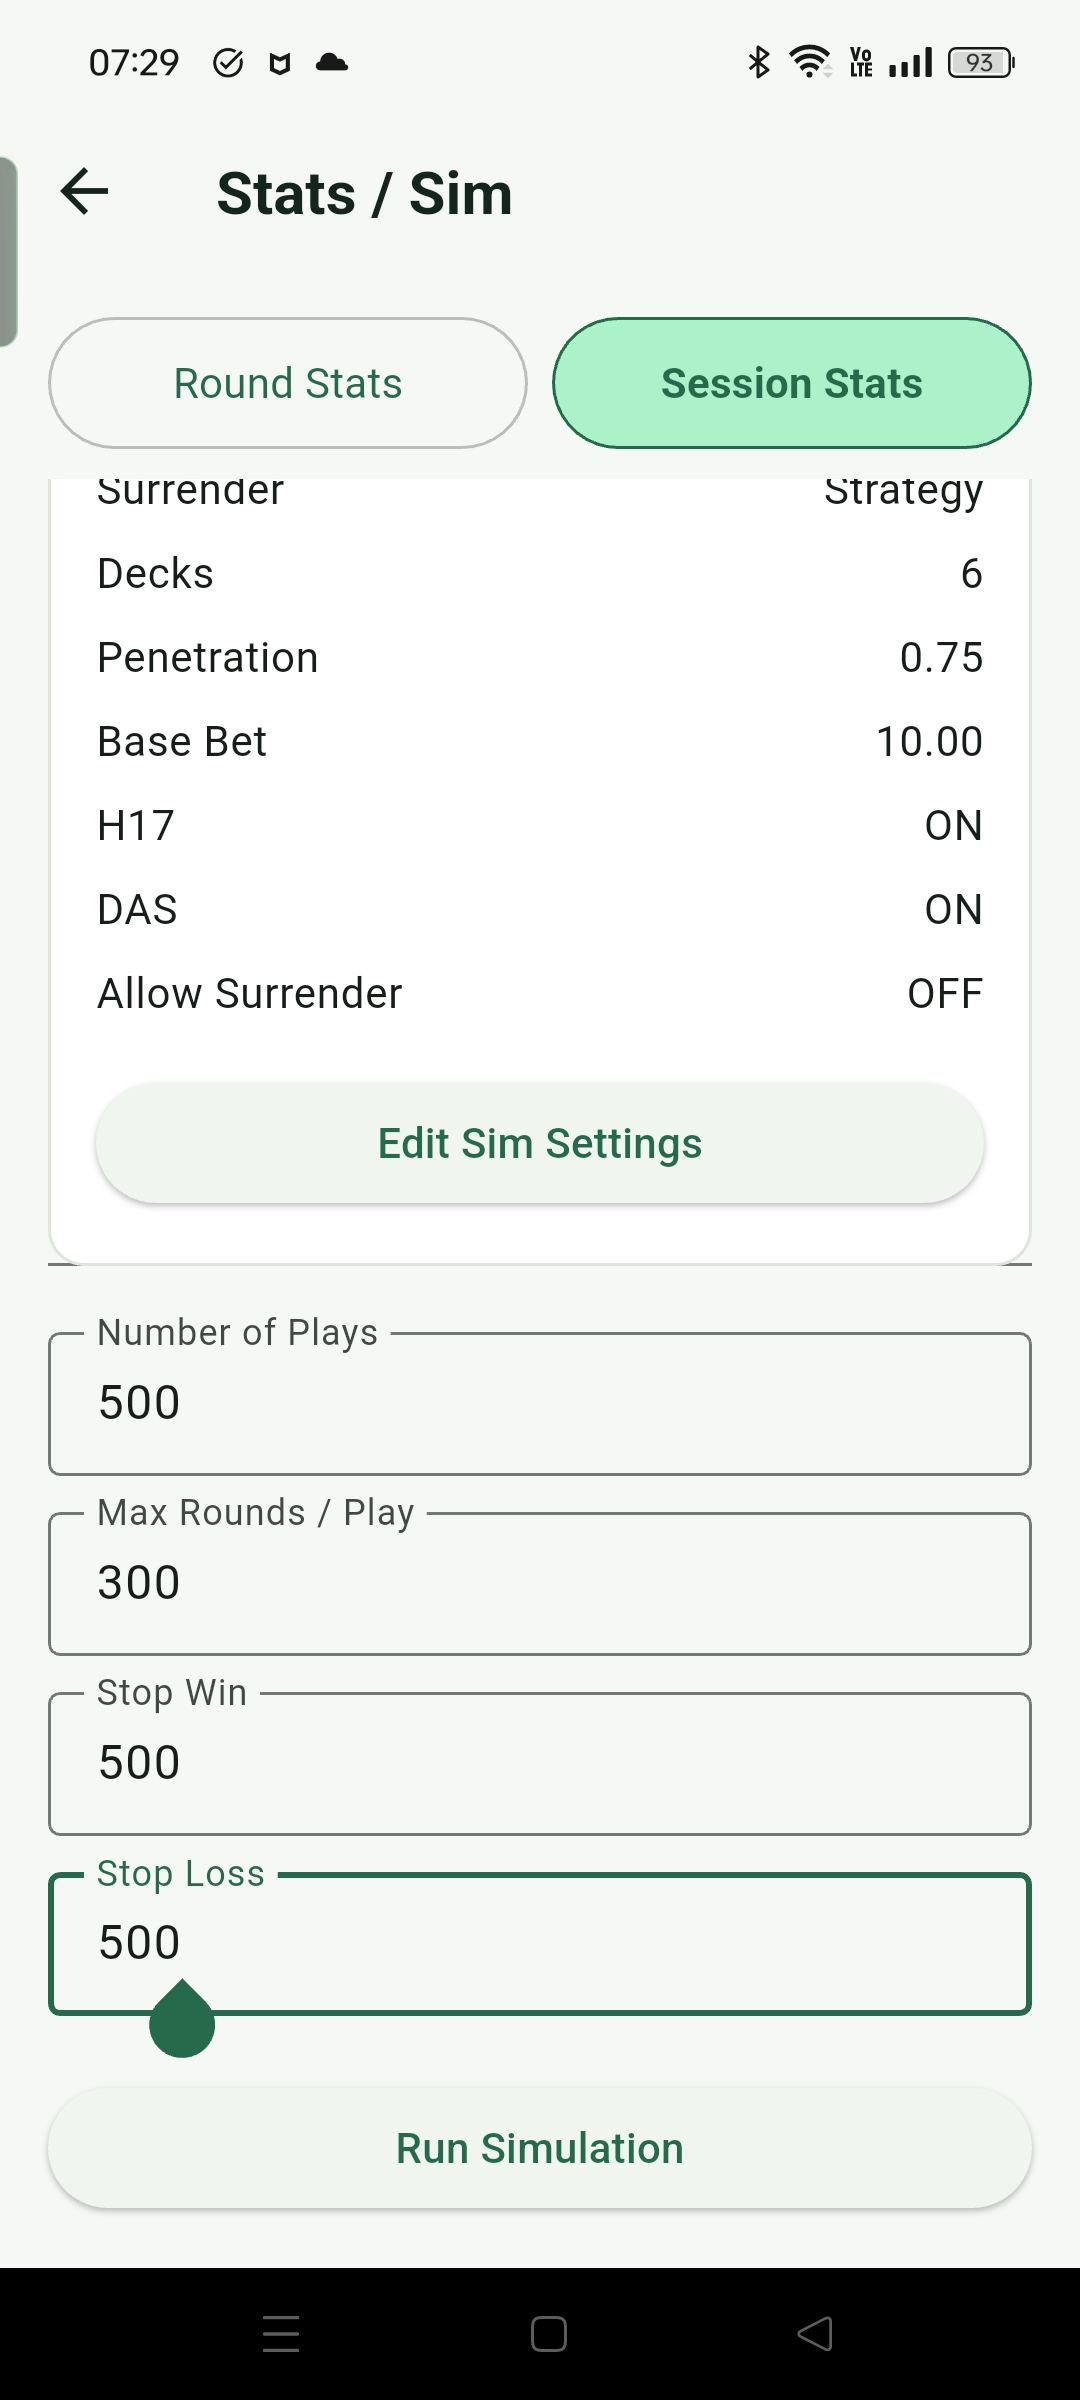
Session Stats simulates results in a way that is closer to real play. In practice, players rarely play tens or hundreds of thousands of rounds in one continuous run, and bankroll limits, stop loss, or stop win rules may matter. This mode therefore splits the simulation into separate Plays. Each Play can set a maximum number of rounds, stop loss, and stop win, while using the same strategy setup such as Hi-Lo, Bet Ramp, rules, and other decision settings.
Stop loss and stop win are checked by whether the current Play's cumulative result has passed the configured threshold. Because high-TC situations can involve larger bets, the Final Net after a hand may go well beyond the stop loss or stop win value. That is closer to real play than forcing the result to stop exactly at the threshold.
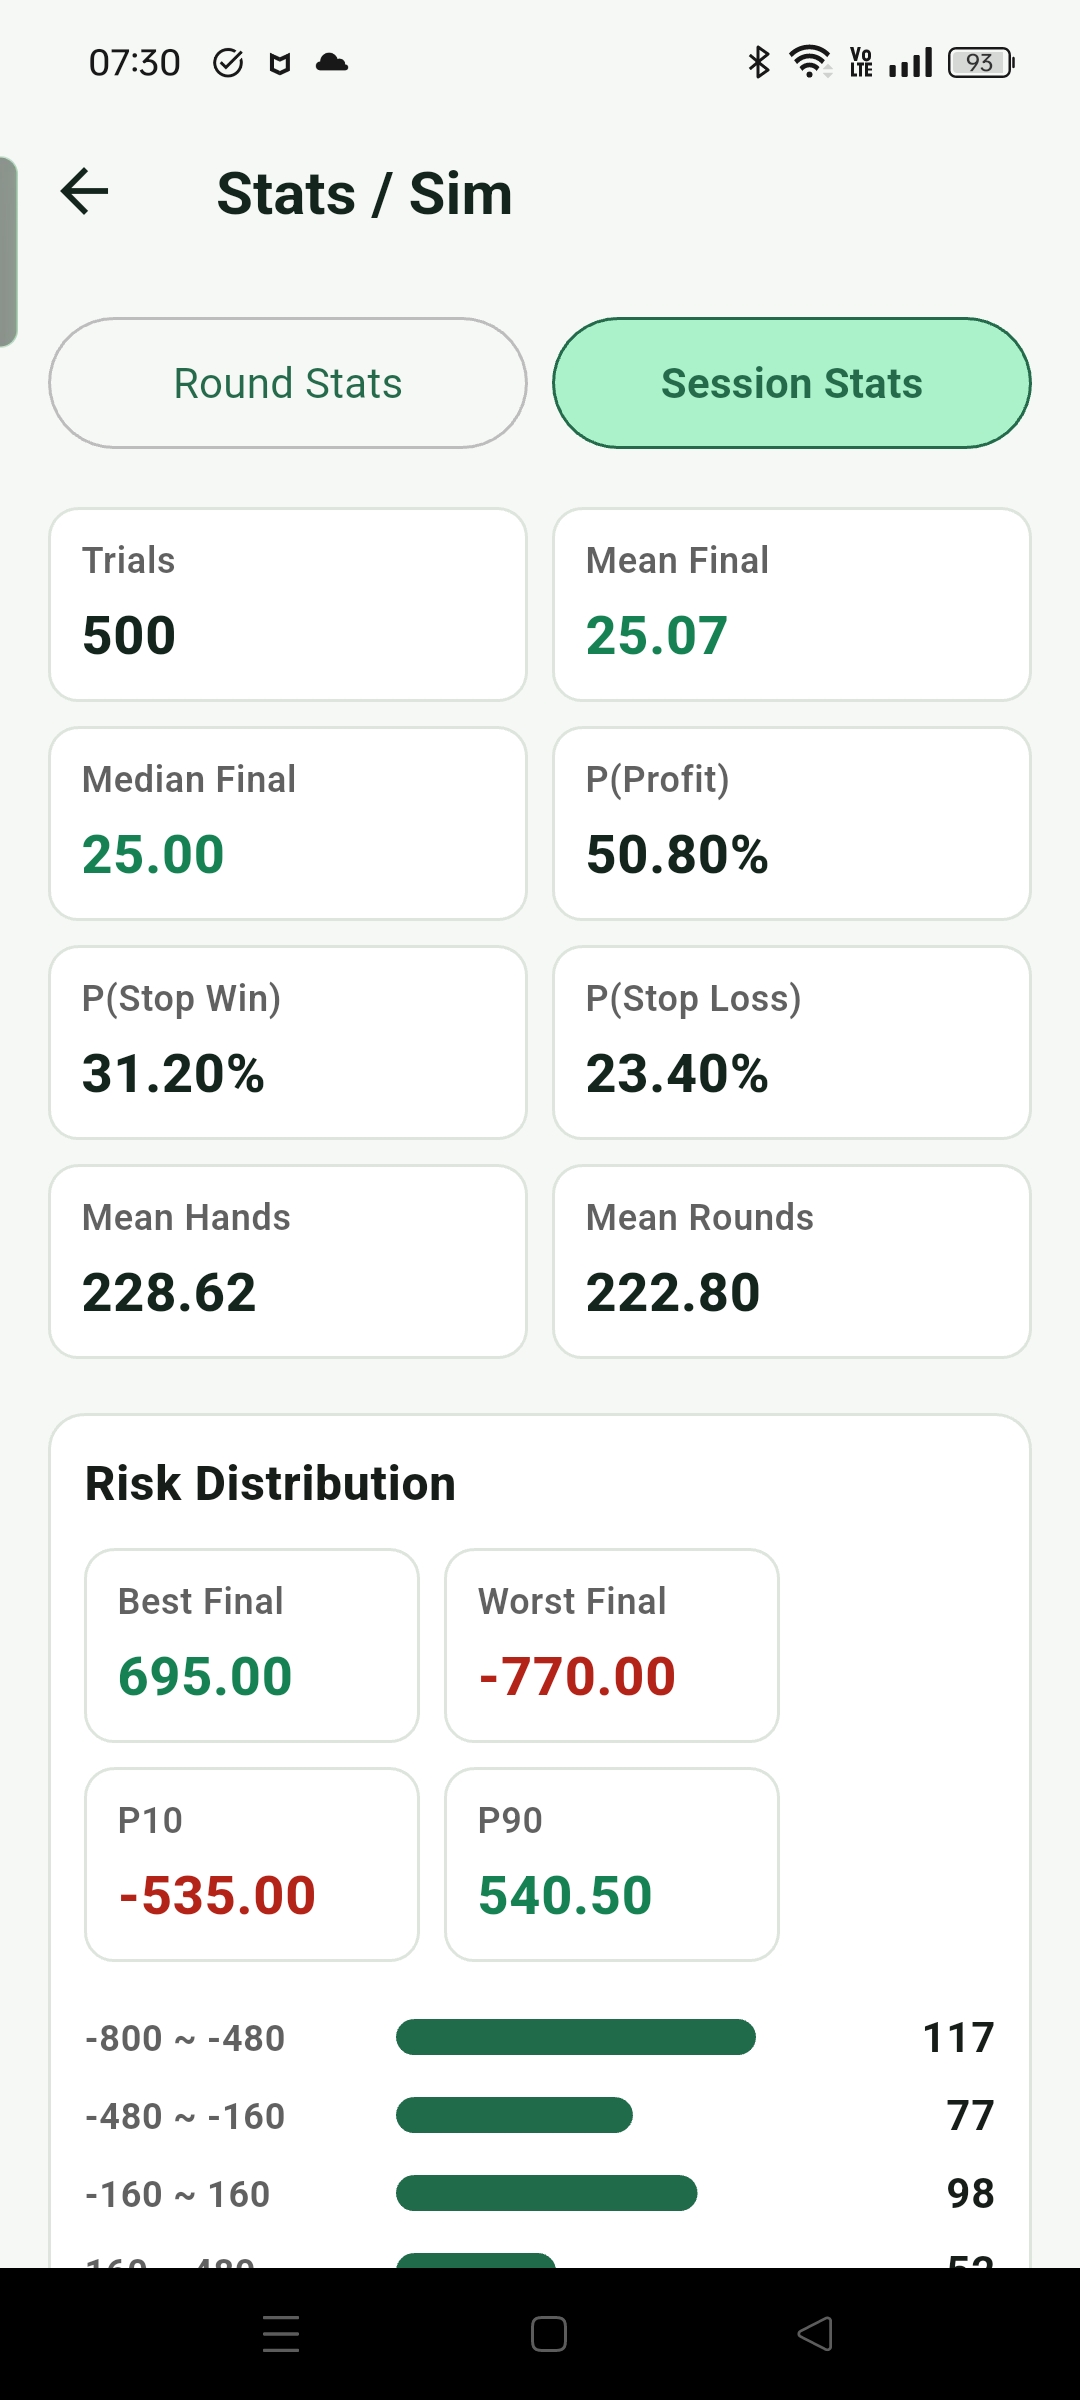
After setting how many Plays to run, Session Stats summarizes the final result of each Play. Results include the average and median Final Net, win/loss ratio, stop loss and stop win hit rates, and the average Hands and Rounds per Play. The screen also includes a simple distribution chart so users can quickly see the profit/loss spread at the end of each Play.
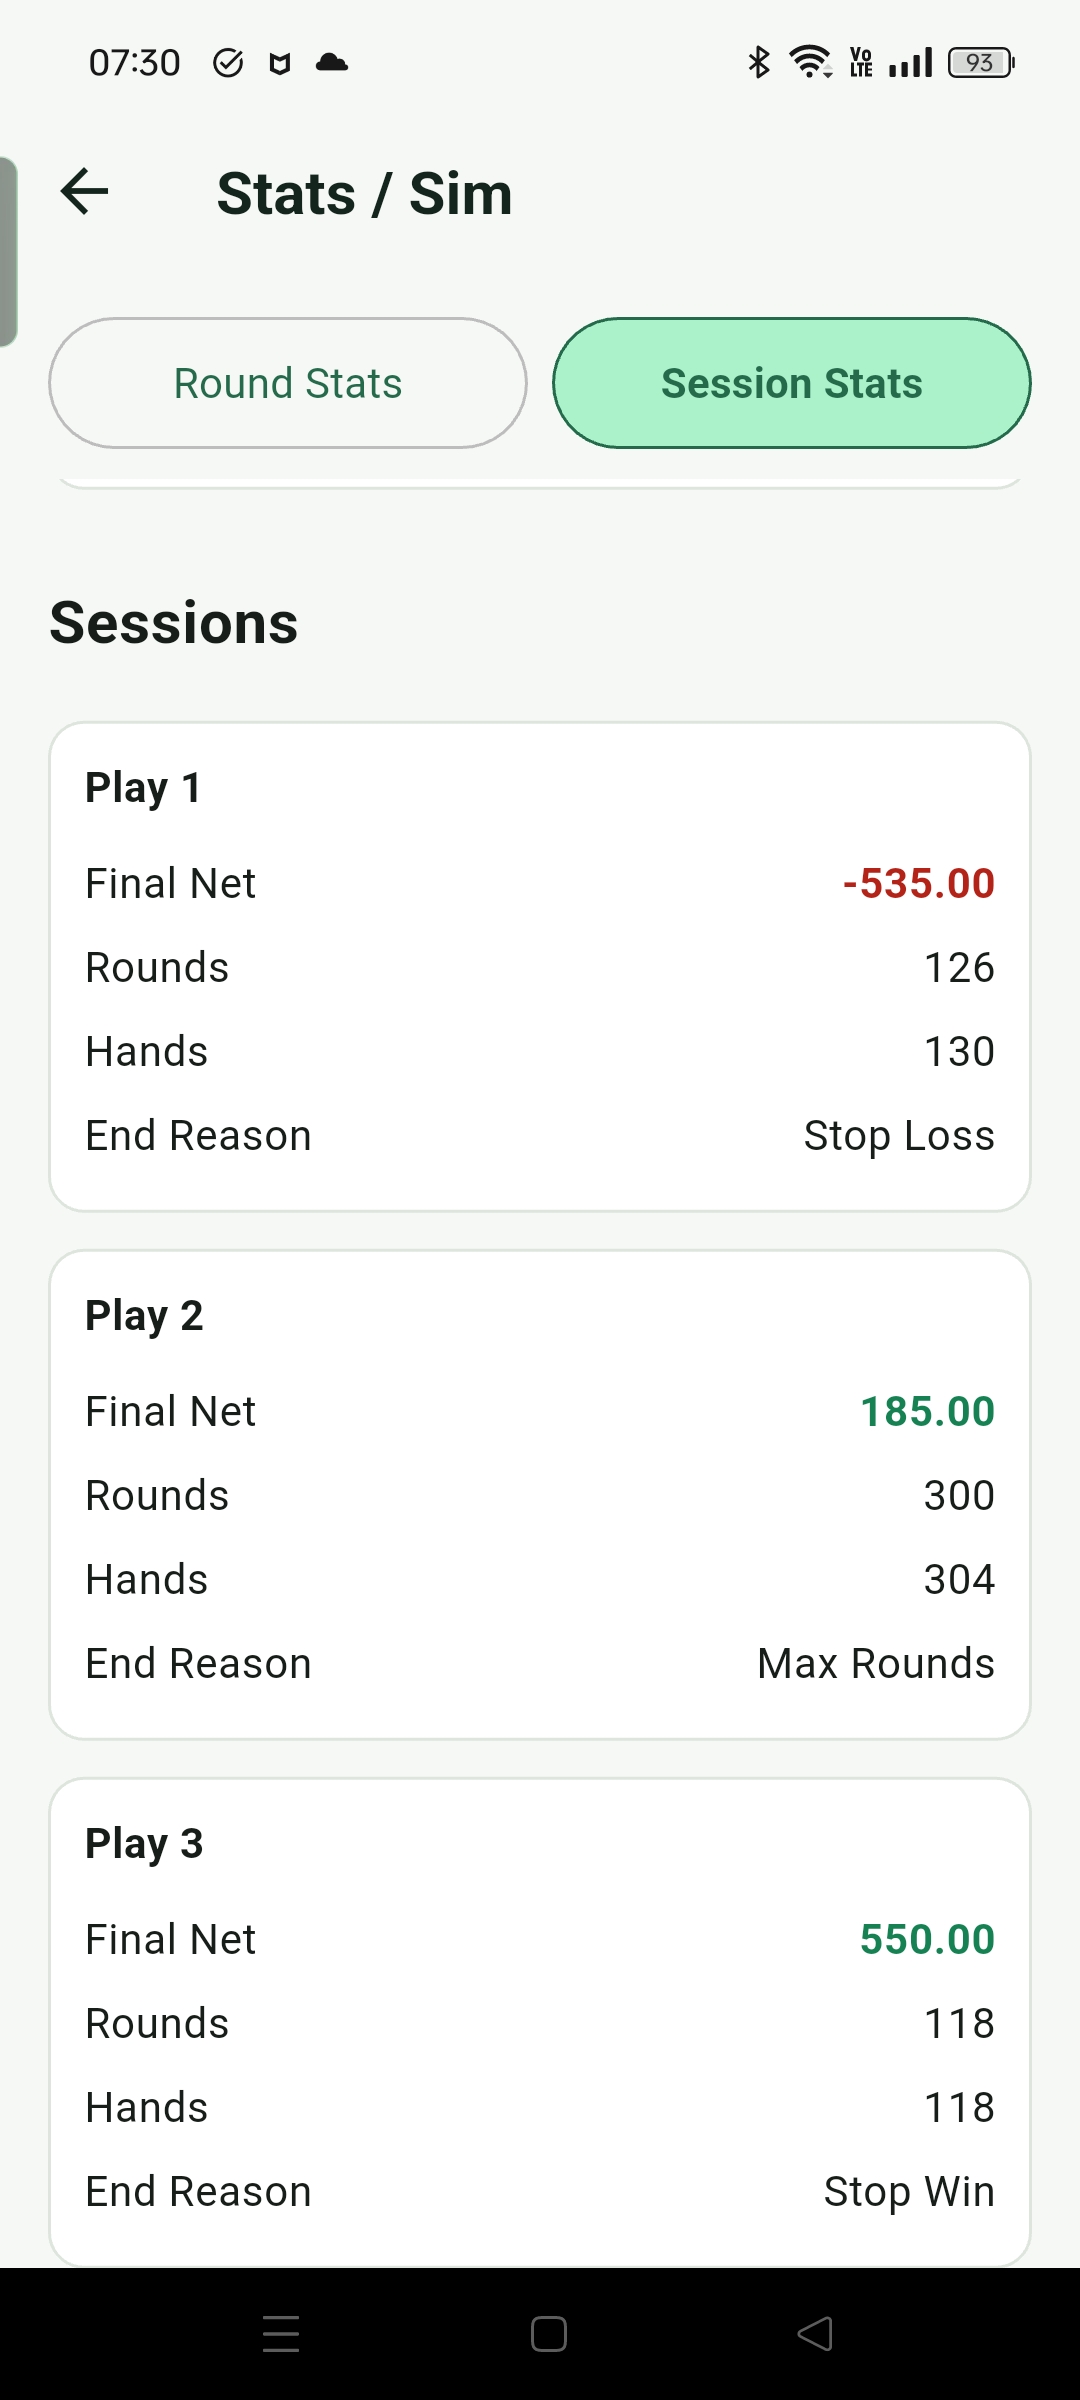
A summary for each Play is also kept below, including Final Net, Rounds, Hands, and End Reason. This design is mainly meant to support stop loss, stop win, and bankroll-management decisions, making it more realistic than only looking at large Round Stats. Counting simulations can still differ clearly from theoretical EV because short-term swings remain meaningful, especially with larger bet spreads. Running the same strategy several times helps check whether the result distribution is stable.