Stats
The Stats page has three sections: Play Stats summarizes your actual play results from Play mode, Simulation Stats analyzes Monte Carlo simulation output, and Files manages stored play and simulation log files.
Sim
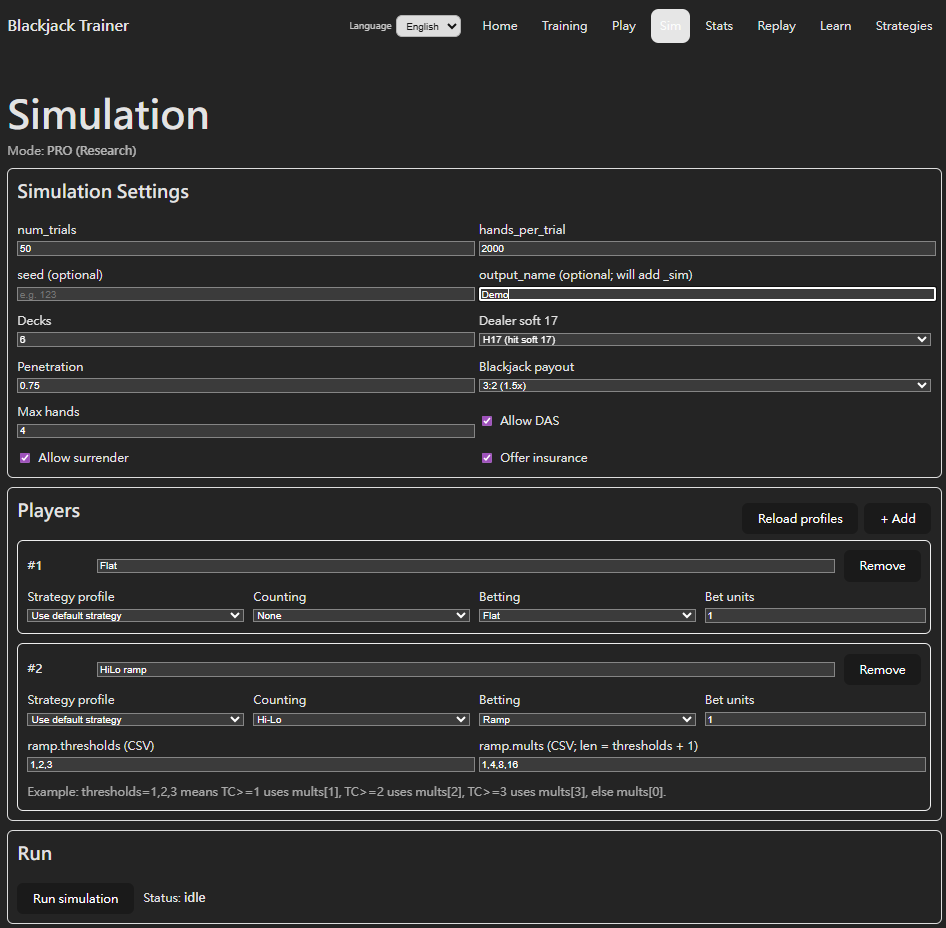
The Sim page is where you configure and launch simulations. The Python engine runs in the background and saves results as a .jsonl.gz file when complete, which you then load in Stats for analysis.
Simulations use a Trial structure: each run performs num_trials independent sessions, each playing hands_per_trial hands. The two values multiplied give the total hand count.
- num_trials (session count): Each trial is one independent session — the shoe resets, the count starts from zero, and trials have no effect on each other. The distribution of results across trials shows how stable and variable a configuration is over the long run.
- hands_per_trial (hands per session): How many hands each trial plays — the "length" of a single session. Larger values simulate longer play; combining many trials gives a distribution of long-term outcomes.
Limits (FREE / PRO): FREE allows up to 50 trials, up to 2,000 hands per trial, and no more than 100,000 total hands. PRO allows up to 2,000 trials, up to 20,000 hands per trial, and no more than 5,000,000 total hands.
- Table Rules: H17 / S17, deck count (up to 12), penetration, Double After Split, Blackjack payout, Surrender, and Insurance — configure to match specific table conditions.
- Counting System: Basic (no counting) or any of the seven supported systems (Hi-Lo, KO, Red 7, FELT, Zen, Hi-Opt I, Omega II).
- Bet Ramp: Set count signal thresholds and bet multipliers to see how betting strategy affects long-term EV and ROI.
- Strategy Profile (PRO): Apply a custom Strategy Profile created in Strategies to simulate long-term EV using your own Deviation rules.
- Multi-seat comparison: Add multiple players to one run, each using different systems or Bet Ramps. All seat results are saved together and directly comparable in Stats.
- Output Name: Name the output file so you can quickly find it in Stats later.
Play Stats
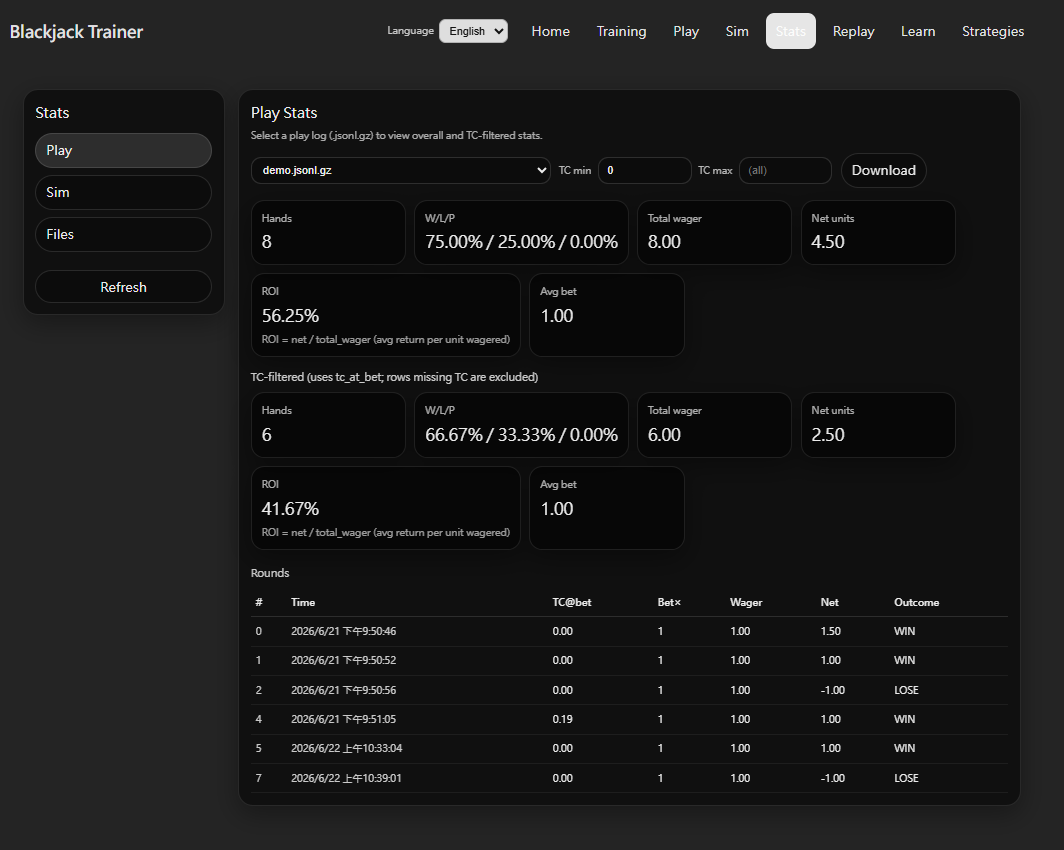
Play Stats loads play logs (.jsonl.gz) recorded in Play mode and summarizes your actual results. Select a log file from the dropdown to view its stats.
- Overall Summary: Total hands, Win/Loss/Push rates (W/L/P), total units wagered, net units won, ROI (= net / total wager), and average bet multiplier.
- TC Filter: Set TC min / TC max to isolate rounds where True Count at bet time falls within a specific range and see stats only for those rounds — useful for confirming whether high-count performance matches expectations.
- Rounds Table: Lists each round with its timestamp, TC at bet (TC@bet), bet multiplier (Bet×), wager, net units (Net), and outcome for round-by-round review.
Simulation Stats
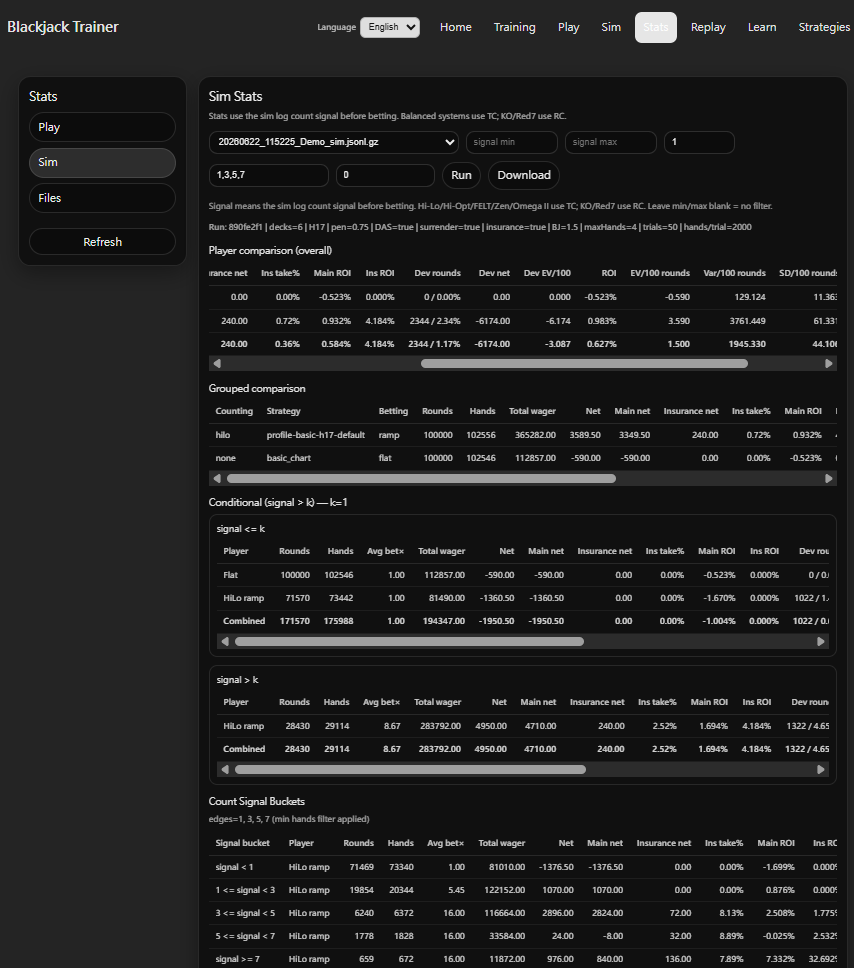
Simulation Stats loads a .jsonl.gz result file generated by Sim and runs multi-angle statistical analysis. Select a file then click Run to load results. Use signal min / max to filter a specific signal range (balanced systems use TC; KO / Red 7 use RC) — leave blank to include all rounds.
- Player comparison (overall): Per-player aggregate stats including Total wager, Net, ROI, EV/100 rounds, Var/100 rounds, SD/100 rounds, and Deviation metrics (Deviation round rate, Deviation net, Deviation EV/100). A Combined row aggregates all players.
- Grouped comparison: Breaks down results by counting system, Strategy, and betting type (ramp / flat) — useful for comparing different configurations within the same simulation run.
- Conditional split (signal > k): Splits results at threshold k, separately showing performance when signal ≤ k (low-count) vs signal > k (high-count), directly quantifying the counting signal's contribution to profitability.
- Count Signal Buckets: Divides results by custom bucket edges (e.g., 1, 3, 5, 7), showing Avg bet×, Net, ROI, and other metrics per bucket — confirms whether EV trends across count states match strategy expectations.
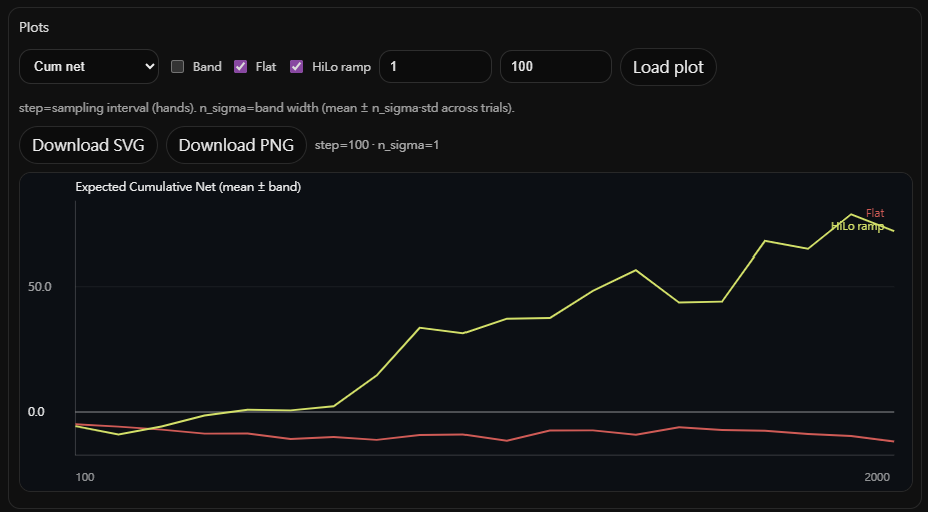
Plots (time series): Visualizes cumulative net units over hands within each trial. Multiple players can be overlaid simultaneously to compare long-term trends under identical simulation conditions.
- Band: When enabled, shows mean ± n_sigma × std across all trials, visualizing the spread of outcomes.
- step: Sampling interval in hands — smaller values produce a smoother curve; larger values compute faster.
- n_sigma: Band width. 1 = mean ± 1 std; 2 = mean ± 2 std.
- Charts can be downloaded as SVG or PNG.
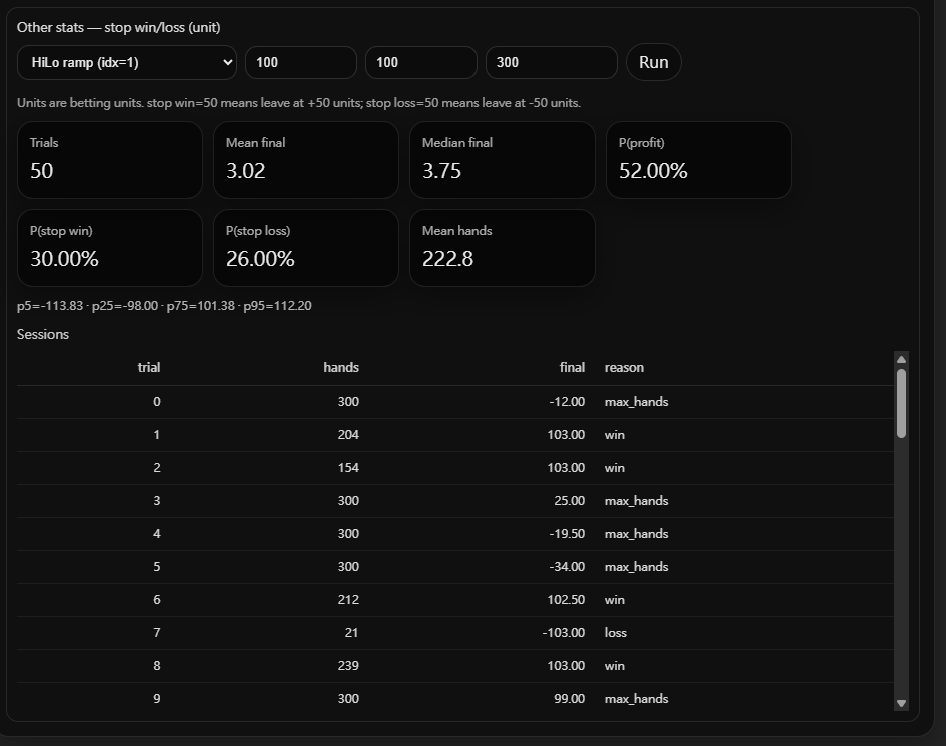
Stop Win / Loss simulation: Applies stop-win and stop-loss rules to each trial in the Sim results, reporting the distribution of final units and how often each trial ends by hitting the win target, the loss limit, or max hands.
- Stop win: The trial ends as "win" when cumulative net units reach the stop-win threshold.
- Stop loss: The trial ends as "loss" when cumulative losses reach the stop-loss threshold.
- Max hands: If neither stop is triggered, the trial ends after max_hands hands, recorded as "max_hands".
- Output stats: Trials count, Mean / Median final units, P(profit), P(stop win), P(stop loss), Mean hands played, and p5 / p25 / p75 / p95 percentile distribution.
- Sessions table: Per-trial detail — hands played, final units, and reason for ending (win / loss / max_hands).
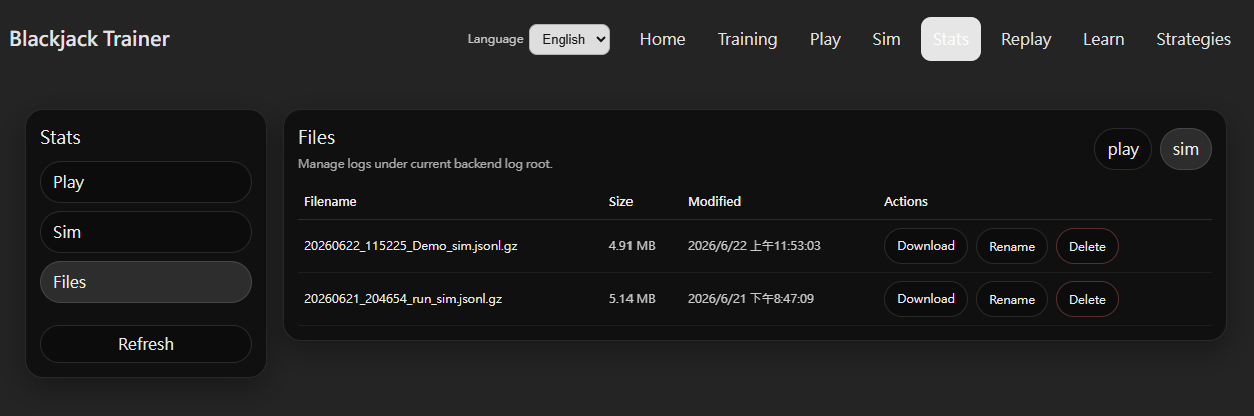
Files
The Files tab manages all log files stored by the local backend. Use the play / sim toggle in the top-right to switch between play logs and simulation results.
- Filename: Files are named with a timestamp prefix in the format
YYYYMMDD_HHMMSS_name.jsonl.gzfor easy chronological identification. - Size / Modified: Shows file size and last-modified time — useful for confirming which file is the latest simulation run.
- Download: Download a
.jsonl.gzfile for backup or custom analysis in external tools. - Rename: Rename a file to organize logs by content, date, or configuration.
- Delete: Remove log files that are no longer needed.