Simulation Validation Examples
One of the main uses of Sim is to validate with statistical data whether a card counting strategy has an edge under specific settings. The examples below show how to read simulation output to confirm whether a strategy is effective, and how to use session statistics to support stop-loss and stop-win decisions.
Cumulative ROI Confidence Interval
The chart below compares four counting systems — Hi-Lo, KO, FELT, and Hi-Opt I — each paired with its own Bet Ramp, showing cumulative ROI from 100 to 1000 rounds with a 95% confidence interval (CI) band. The simulation used 1,000 trials of 1,000 rounds each.
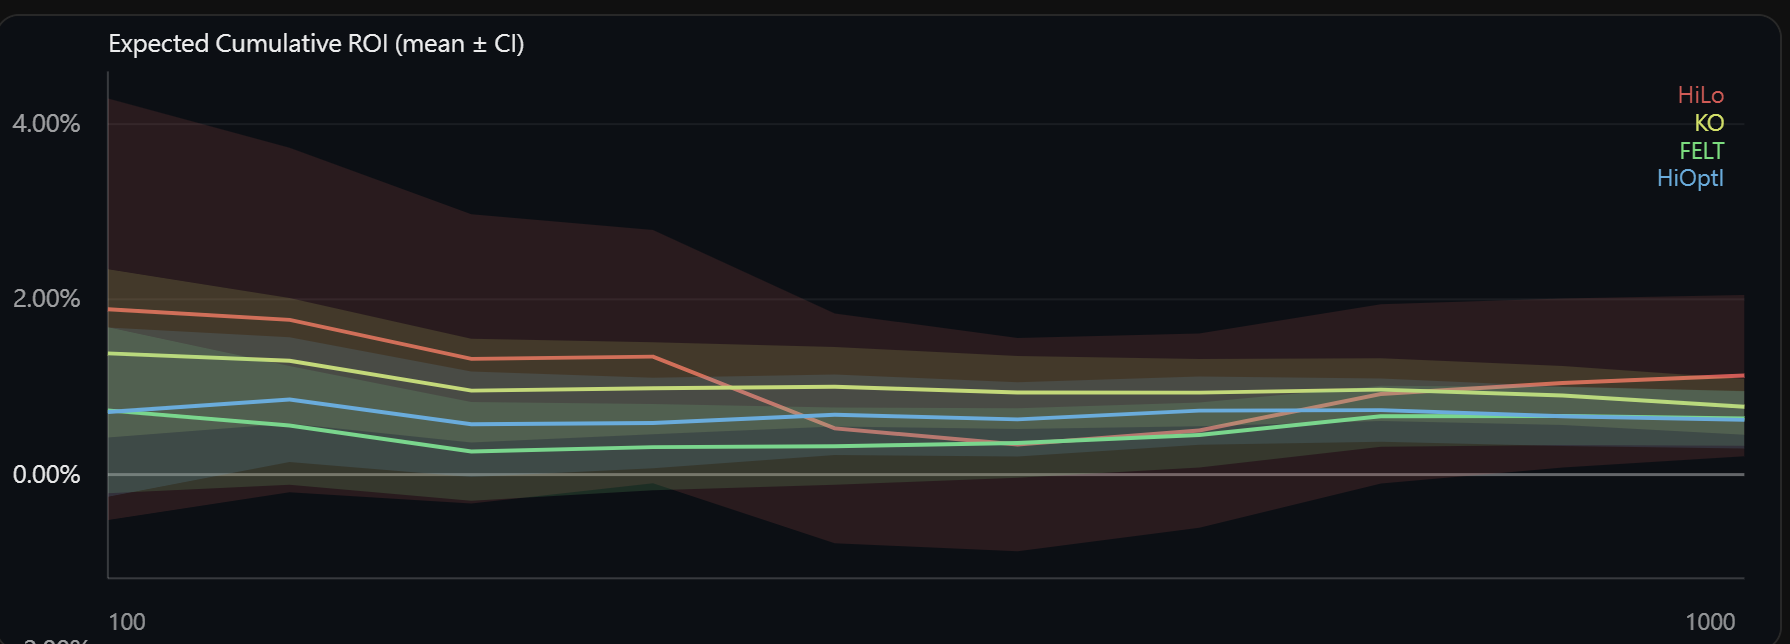
The key is the lower bound of the CI. When the 95% CI lower bound stays above 0% throughout, it means that even the most conservative statistical estimate still shows positive cumulative ROI under these strategy and Bet Ramp settings. This confirms that the strategy has a statistically significant edge under the table rules and penetration used in the simulation.
Note that each of the four systems uses a different Bet Ramp, so this chart validates each system's strategy independently rather than comparing which system performs better. To compare systems directly, a separate simulation with the same Bet Ramp applied to each would be needed.
KO Session Stop-Loss / Stop-Win Statistics
Beyond cumulative ROI, Sim can also model session results with stop-loss and stop-win conditions, helping evaluate bankroll management settings. The example below uses the KO system (idx=1) with stop-loss and stop-win both set to 100 units and a maximum of 300 rounds per session, run over 1,000 sessions.
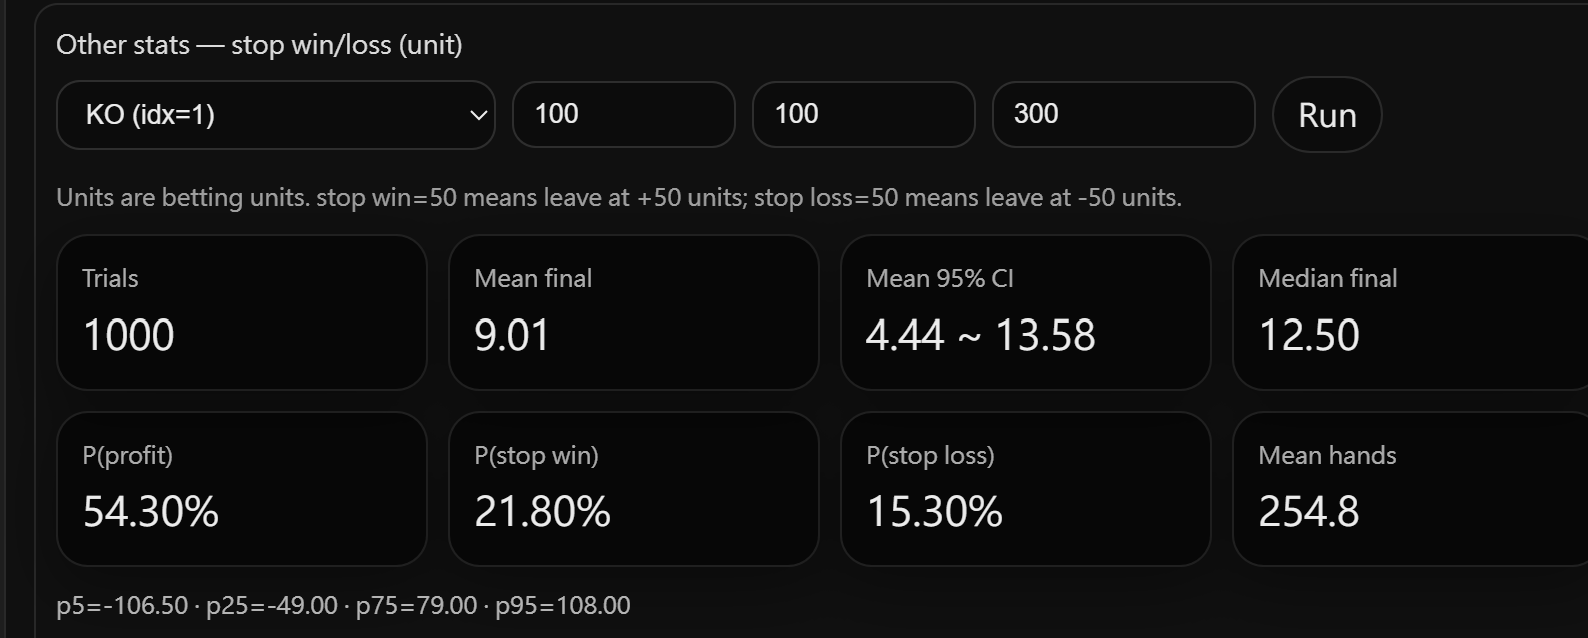
The results show a mean final of +9.01 units with a 95% CI of 4.44 to 13.58, entirely above zero. P(profit) is 54.3%, and P(stop win) at 21.8% exceeds P(stop loss) at 15.3%. This confirms that under this KO counting, Bet Ramp, and stop-loss/stop-win configuration, session results are statistically profitable with meaningful confidence.
By adjusting the stop-loss and stop-win values and re-running the simulation, you can compare how different bankroll management settings shift the result distribution and find a combination that matches your risk tolerance.